PCAP Analysis with Wireshark and Tshark | Digital Forensics and Incident Response
Introduction
PCAPs can greatly aid an investigation after an incident has occurred. However, PCAPs contain massive amounts of data that is difficult to parse and time is valuable, especially during live investigations. How do we then swiftly perform a PCAP analysis that covers maximum ground? This post provides a quick summary of analysis that can be done by Wireshark and its accompanying CLI tool, tshark.
We will be using sample pcaps in this post. Grab a sample PCAP file here.
Quick Insights with capinfos
capinfos is a CLI tool that ships with Wireshark and can be useful to derive quick insights about the PCAP. It resides in the Wireshark directory, same as tshark and reordercap – the other CLI tools that ship with Wireshark. In my case (MacOS), capinfos was found here:
/Applications/Wireshark.app/Contents/MacOS/capinfos
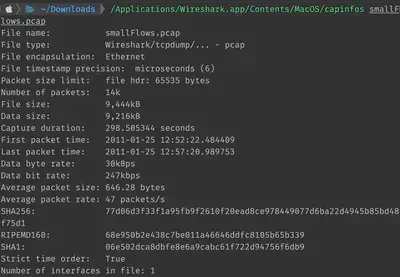
We therefore immediately see that this packet capture ran for a few minutes, with the first and last packet seen 5 minutes apart. Data byte rate suggests that the network was not under heavy load during the time.
PCAP analysis with Wireshark
Wireshark has become the industry-standard network capture analysis tool, and for good reason. It is powerful, flexible and a great tool to have in your DFIR arsenal.
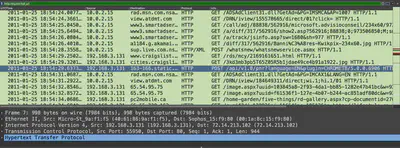
Adjusting timezone
By default, Wireshark will display timestamps in absolute time since the start of the capture. Unless you can read and interpret these, it’s best to change these timestamps to human-readable dates and times. I usually change them to UTC for my investigations.
View -> Time display format -> UTC date and time of day
Protocol Hierarchy
One of the first things I like to do after loading a PCAP in Wireshark is to look at the protocol hierarchy to understand the kind of traffic that the PCAP contains.
Statistics -> Protocol Hierarchy
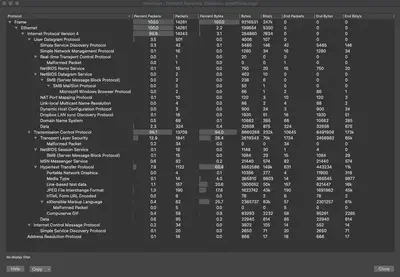
We see that we mostly have TCP traffic in this PCAP (96.1%) with a little bit of UDP (3.5%). Within TCP, we have mostly TLS and HTTP traffic.
IO Graphs
Next, it is good to build a timeline of traffic activity and fortunately Wireshark has I/O graphs for this purpose.
Statistics -> I/O Graphs
I usually select Time of day within the IO graph to see the accurate date and timestamps on the X-axis.
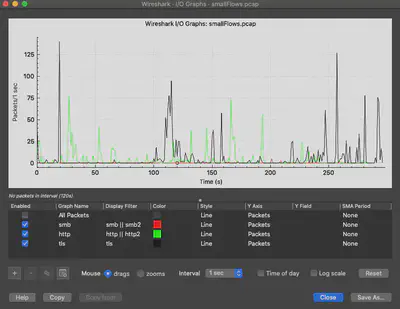
Color the different protocols (or combinations of protocols set with display filters) to improve the visualization. You can display all packets OR just the protocols that you are interested in.
Identify conversations between endpoints
During the capture, several entities could be talking to each other and not all of those conversations are of interest during the investigation. First, identify what conversations took place and then check to see if they are relevant to the investigation:
Statistics -> Conversations
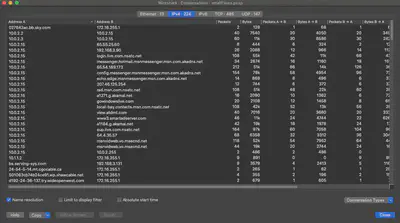
I usually check ‘Name resolution’ which makes it easy to identify domain names. Enable name resolutions in the Wireshark options first:
Preferences -> Name resolution -> Use an external network name resolver
Next, Wireshark provides the ability to quickly identify all endpoints involved in conversations:
Statistics -> Endpoints
Display Filters
Display filters make it easy to make sense of the vast amounts of information contained within large PCAPs. Without unlimited time and patience, it is infeasible to scroll through the millions of packets that could be contained within the PCAP. Therefore, zeroing in on relevant information by specifying display filters is a good practice.
There are vast amounts of details available online on Wireshark display filters which I won’t attempt to replicate. Personally, I frequently use the following display filters during my investigations:
Operators:
    ||
    &&
    !
    contains
    ==

Filters:
    smb || smb2
    http || http2
    tls
    ip.addr == <ip>
    http.request.full_uri
    tcp.port == <port>
    tcp.stream eq <stream>
    !(arp or icmp or dns)
    frame contains <searchstring>
    !tcp.analysis.window_update
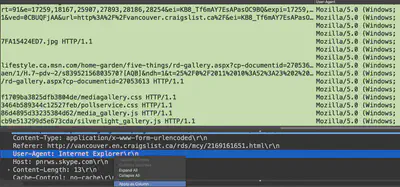
If you find interesting information while examining the details, you can use the ‘Apply as column’ feature to add that as a column in your analysis. For instance, here I am adding user-agent strings under a column:
Data extraction with tshark
tshark is the command-line utility that ships with Wireshark and can provide easy and flexible command-line access to the PCAP analysis data that can then be piped directly to grep, awk etc. for quick comprehension. tshark thus enables quick scripting.
Note: Before beginning analysis with tshark, it is advised to reorder packets using Wireshark’s reordercap. While Wireshark does this transparently for the user, tshark will not and therefore the incorrect packet ordering will lead to inaccurate timestamps. Accurate timestamps are crucial for building DFIR incident timelines.
reordercap resides next to tshark in the installation directory of Wireshark. On my Mac, this directory was: /Applications/Wireshark.app/Contents/MacOS/
Run reordercap to derive a new PCAP with ordered packets:
reordercap -n orignal.pcap REORDERED.pcap
Basic tshark query format
I primarily use the following query format when extracting information with tshark:
tshark -r <pcap> -T fields -e <fieldname> -Y ...

where
    -r  read PCAP
    -T  set the format of output
            (if using 'fields', follow with -e)
    -e  extract specific field
    -Y  display filters
    -E  control printing of fields
            (use with 'separator=,' for CSVs)
Accessing Wireshark columns via tshark
tshark can display data from columns created in Wireshark using _wc.col.X where X is the column name observed in Wireshark.
I usually create new columns in Wireshark and then extract the data in CLI using tshark with -e _ws.col.<columnname>
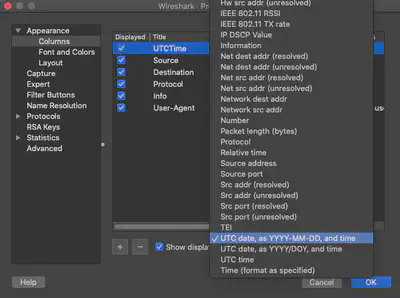
First, create a new column in Wireshark (in this case UTCTime):
Preferences -> Columns -> Add
The new display filter can now be used in tshark:
Sample tshark extractions
tshark -r <pcap> -T fields -e _ws.col.UTCTime -e ip.src ip.dst -Y "http || http2"

tshark -r <pcap> -T fields -e _ws.col.UTCTime -e _ws.col.Destination _ws.col.Info -Y "smb2"

tshark -r <pcap> -T fields -e _ws.col.Info -Y "smb2" || grep -B2 -C2 "FAIL"

tshark -r <pcap> -T fields -e _ws.col.UTCTime -e ip.src -e ip.dst -e dns.qry.name -Y "dns.flags.response eq 0"

tshark -r <pcap> -Y smb2 | grep -B4 -C4NTLMSSP_AUTH

tshark -r <pcap> -Y http -T fields -e http.user_agent

tshark -r <pcap> --export-object http,.

tshark -r <pcap> -Y "udp or tcp" -T fields -e _ws.col.Protocol -e _ws.col.SrcPort -e _ws.col.DstPort -E separator=,

tshark -r <pcap> -Y -e _ws.col.Time ntlmssp.auth.username -T fields -e ip.dst -e ntlmssp.auth.domain -e ntlmssp.auth.username

tshark -r <pcap> -T fields -e eth.dst eth.src

tshark -r <pcap> -T fields -e frame.protocols | sort | uniq -c | sort -nr
In the examples above, _wc.col.X pertains to the columns in Wireshark. Therefore, if you have enabled name resolution in Wireshark, IP addresses will be resolved in the tshark output as well.
Conclusion
While Wireshark and tshark are great tools for network packet capture analysis, I have found them lacking when PCAPs are sizable. For instance, PCAPs I was recently analyzing were several GBs in size and Wireshark struggled even on my Macbook Pro 16 (2019) with 32 GBs of RAM. To that end, we should be exploring other options when dealing with massive amounts of network capture data.
Additional links
Pranshu Bajpai
Principal Security Architect
Pranshu Bajpai, PhD, is a principle security architect..